


Paschen-Runge
HISTORY
The development of spectroscopic methods and with that of spark spectroscopy is closely connected to the work of several great scientists:
Isaac Newton
In the 17th century, the British scientist Isaac Newton let a sunbeam pass through a slit in some wooden shutters and fall onto a prism. He was interested to see that the white light appeared as a rainbow-coloured band on the wall, whereby each colour had been bent to a different degree by the prism. He then wondered if this effect could be reversed. He therefore passed the multicoloured light through a second prism again that was placed upside down. A white beam of light appeared again. Newton had proved that white light was made up of multicolour rays.
William Hyde Wollaston
At the beginning of the 19th century, William Hyde Wollaston continued Newton’s optical experiments with sunlight and used ever smaller slits through which the sunlight could pass. He noticed dark, narrow bands within the rainbow colours that were devoid of any colour. However, his observations were ignored by the scientific community.
Joseph von Fraunhofer
Again in the early years of the 19th century Joseph von Fraunhofer developed a diffraction grating with grooves at intervals of 0.003 mm. This grating worked in a similar manner to a prism, i.e. it broke white light into spatially separate colours, but in doing so achieved a greater resolution of the individual colours. In the year 1814 Fraunhofer took up Wollaston’s work again and described the Fraunhofer lines of the solar spectrum that were named after him.
John Herschel
John Herschel investigated the way different salts behaved in flames. In 1832 he observed different colours that he used for experiments.
Bunsen & Kirchhoff
 Like John Herschel, Robert Wilhelm Bunsen also worked with flame colours. In 1859 Bunsen and Gustav Robert Kirchhoff discovered and explained the reversibility of emission lines, which is expressed in the first law of emission: “Every body absorbs the same radiation type that it emits when energised.” As a result they were able to identify the Fraunhofer lines as absorption lines of gases (hydrogen) and also explained the origin of Herschel’s flame colours as a characteristic property of the atoms vaporised in the flame. Their publications laid the foundation stone of qualitative spectral analysis that permitted the detection of chemical elements.
H. A. Rowland
In 1882 Henry Augustus Rowland improved the production of reflection gratings and created a concave grating. Spectrometers fitted with a Rowland grating did not need a lens to focus. The only optical element was the concave grating. The entrance slit, grating and observation (detection) plane are all on a single circle, the Rowland circle.
F. Paschen & C. Runge
The physicist Friedrich Paschen and the mathematician Carl Runge used Rowland’s work and at the beginning of the 20th century developed today’s popular polychromator spectrometer mounting (Paschen-Runge configuration).
Spectroscopic Devices
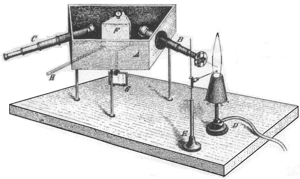
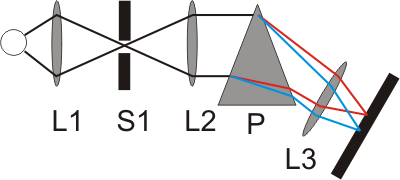
Early spectroscopic devices for observing solar and flame spectra consisted of an entrance slit, lenses, prism and an observation screen. The light passing through the narrow entrance slit (S1) was broken into the different wavelengths by the prism (P). With the help of the lenses (L1 to L3) these wavelengths were focused on a screen on which several coloured images of the entry slit would become visible: the emission lines.
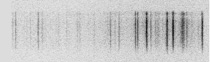
 While these emission spectra were originally only observed with the naked eye, photo plates were later used that were mounted at the focal plane of the device. The photo plates were then exposed by the incident light. The intensity of the emissions were reflected by the strength of the emission lines. These early spectroscopic devices later resulted in the spectrometer, a machine that made it possible to determine the quantitative and qualitative composition of an analyte. This is also made evident by the name of the method: devices that work on the basis of quantitative analysis methods are called spectrometers. When you see the photo plate, it is easy to understand where the term “spectral lines” comes from.
 It was then discovered that when using spark spectrometry, many important emission lines lie outside of the visible range in the adjacent UV range down to 200 nm. In contrast to the human eye, photo plates can detect this range. Spectrometers of this kind were therefore fitted with UV-permeable optical components (quartz glass).
As radiation below approx. 200 nm is absorbed by air, it was necessary to either create a vacuum within the spectrometer using a vacuum pump or fill the device with a transparent gaseous medium (argon or nitrogen). This so-called vacuum UV range made important emission lines for P, S, N, O and C accessible and with that defined the bandwidth range of 110 nm to 800 nm used today.
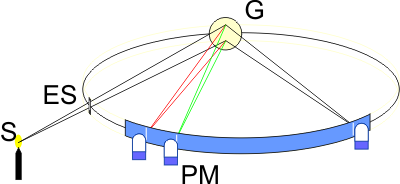 The American H. A. Rowland made an interesting discovery at the end of the 19th century. If one attaches a dispersion grating (G) to a concave, mirrored surface, the grating takes on two important properties: it firstly disperses the incident light according to wavelength and focuses the image of the entrance slit (ES). If one mounts the grating and the entrance slit on a circle, all wavelengths appear on this circle without needing any further optical elements (Rowland circle). This mounting method has advantages regarding wavelength stability and light output. The light output can be further increased by using blazed holographic gratings. Nowadays, it is practically only emission spectrometers that use gratings as the dispersing element. In the field of spark spectrometry, Rowland gratings and Paschen-Runge mountings are common.
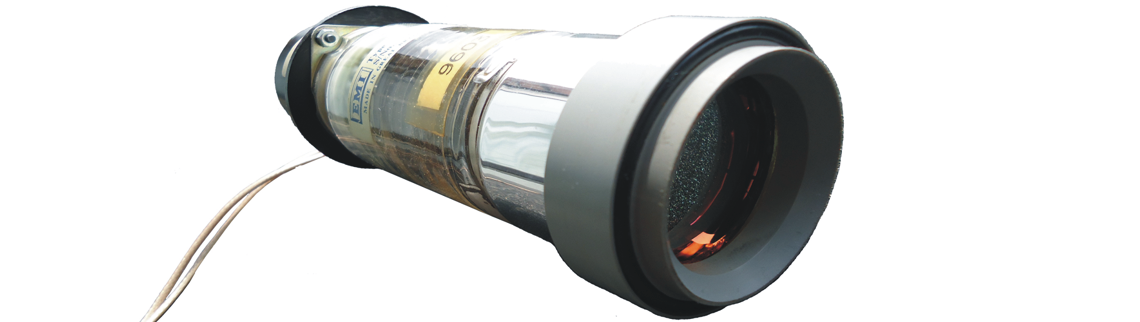
Using photo plates as detectors, which remained common practice up until about the 1950s, made it possible to record the entire emission spectrum. Being highly sensitive, photo plates react to even the tiniest amount of light. However, they also go hand in hand with a complex analysis process as a separate photo plate has to be developed for each analysis, thus precluding speedy production control. From about the 1950s onwards, photomultipliers (PMs) started to be used. A PM generates and intensifies electrons from entering photons. The emission spectrum can be recorded with only one PM (scanning monochromator). Alternatively, every relevant wavelength position can be fitted with an exit slit, through which photons are directed to a PM that is optimised for the given wavelength range. The resulting photocurrents are integrated into capacitors and generate a voltage that is proportional to the amount of entering light. The electrical signals can be processed immediately and the measured values digitally displayed. With the advance of computer technology, it was possible to convert these measured values into concentrations for on-screen display. This innovation gave rise to a quick and precise detection method covering the entire spectral range that was suitable for performing routine analysis tasks. Provided they are suitably calibrated while the spectrometer is being constructed, numerous element channels can be recorded simultaneously using photomultiplier systems.
In the more recent past, electronic spectrometer components were improved with the help of semiconductors and greatly reduced in size. As a result, semiconductor-controlled excitation generators are used by now that contain no wearing parts. Spark spectrometry has become established as an important quality control element in the production of metals and alloys. During the last 20 years, increased effort has gone into automating the analysis process: sample preparation, sample transport, analysis and transfer of results. Modern spectrometers are also increasingly capable of independently monitoring their own status thanks to the inclusion of intelligent functions.
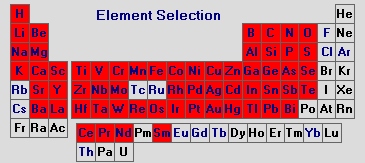
The elements marked in red in the periodic table shown below can be detected down to concentrations of only several µg/kg using spark spectrometry.
SPARK STAND
In the spark stand, sparks are generated between a tungsten electrode and the analyte with a repetition rate of 100 to 1000 Hz. During the sparking phase, every spark removes material particles from the sample. These particles must be completely purged from the spark chamber to guarantee operation without having to clean the spark stand. The spark stand has to be fitted with a light channel to direct the emitted light to the optical system. The light channel and spark chamber have to be flushed with argon as traces of ambient air would prevent any meaningful analysis due to poorly formed focal spots and a consequent insufficient degree of repeatability. Furthermore, analysing carbon, nitrogen or oxygen requires a pure argon atmosphere. Should this be necessary, the spark stand can also kept permanently flushed with argon when the spectrometer is in stand-by mode. This prevents air from entering the spectrometer when it is not in operation, but increases running costs.
The spark stand should be made of non-wearing materials, in particular the spark stand plate and counter-electrode, as this results in longer intervals between necessary adjustments. Buzzwords like “maintenance-free spark stand” are indicators of this.
A few years ago, spark frequencies typically did not exceed 400 Hz. As a result of improvements in excitation and argon flow, frequencies of up to 1000 Hz can be achieved today. However, this requires complete spark chamber deionisation in the intervals between sparking phases. Higher frequencies lead to shorter analysis times.
OBLF Technology
The sparking process must occur under extremely well defined conditions for results to be reproducible. After all, the aim is to ensure that information about the composition of a sample is reproducibly displayed in the emitted light spectrum. The light radiated from the spark stand then turns data carrier and can be analysed by the optical system.
The OBLF spark stand ensures outstanding reproducibility and long-term stability of analysis results thanks to the excellent fluidic design of its inner workings, the use of high-quality materials as well as intelligent constructive engineering. These positive properties remain intact for the whole of the spectrometer’s service life and without any servicing needs! This is also due to the integrated self-cleaning function, which works on the basis of a high-pressure argon pulse and can only be found in OBLF spectrometers – the technology is patent protected! The intervals between cleaning the spark stand can therefore be extended to 104 sparkings.
Our overall concept has naturally also taken everything into consideration to ensure a minimised memory effect, which has resulted in a typical value of <10-6!
Despite the bundled know-how that has gone into this relatively small component, its design affords the user open and easy access, thus also enabling analysis of large and irregular samples. The integrated automatic sample pressing device ensures rapid sample changes.
This unique combination of development parameters was specially selected for automated spectrometer applications and guarantees continuous interference-free automated operation. For applications in automated production lines, the spark stand is fitted with an additional motor-driven cleaning function for the counter-electrode. This closes off the spark stand between analyses and thus takes the strain off the handling system.
When manually operating the system, users benefit from the safe, quick and convenient handling function throughout the device’s entire service life.
OBLF Spark Stand – Technical Specifications:
| Medium: | argon-flushed |
| Wavelength range: | upwards of 100 nm |
| Spark succession frequency: | up to 1 kHz |
| Argon consumption: | program-dependent, upwards of 3 l per analysis no consumption during standby |
| Sample contact pressure: | pneumatic |
| Useful electrode life: | 105 sparkings |
| Memory effect: | typically <10-6 |
| Electrode cleaning | automatic cleaning as option |
GDS SPARK GENERATOR
Sparks
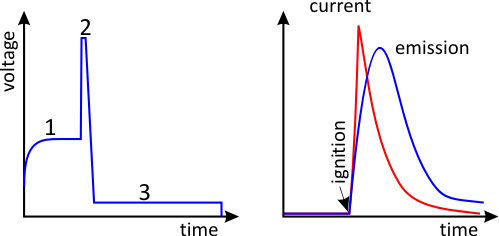
A spark is a discontinuous type of discharge that occurs in several phases. Initially, the energy needed for the spark discharge is supplied by a reservoir capacitor of a given capacitance. The interval between two sparks is used to recharge the capacitor (1). Every spark then has to be ignited, for which a high-voltage pulse of several kilowatt is used (2). This creates an almost constant burning voltage between the electrode and the sample (3). The spark then runs for several hundred µs.
Strictly speaking, both sparks and arcs play a role in spark spectrometry. A continuous arc can be created with relatively simple excitation generators in an air atmosphere. For quantitative analyses, though, spark generation in an argon atmosphere provides numerous advantages. For instance, spark spectrometry with argon prevents sample oxidation and thus any fundamental changes in the sparking conditions during an analysis involving several thousand sparks. Spark excitation therefore delivers a substantially higher degree of repeatability than arc excitation. The latter named method plays a role in mobile spectrometers used for material recognition.
As a rule, the sample material is conditioned prior to the analysis phase. During this pre-sparking phase, the sample material is homogenised, for which higher spark energies are typically used than for measuring phases (HEPS – High Energy Pre-Sparking).
In the early years, the excitation conditions of a spark discharge used to be characterised by three parameters, charge capacity C, inductivity L and resistance R, and the first excitation generators filled entire rooms. Apart from the analytical sparking distance, a wear-prone auxiliary sparking distance was also typically used. However, the ability of this kind of excitation generator to produce constant discharge parameters was limited. To ensure an acceptable degree of long-term stability of the analytical data, it was often necessary to perform control or corrective measures (recalibration) when using such excitation generators. On top of that, it proved to be difficult to create numerous different discharge forms, as are absolutely necessary when using multi-matrix devices. Nowadays, excitation generators can be produced using semiconductors and no longer require an auxiliary sparking distance. They are characterised by a high degree of repeatability, good long-term stability and no maintenance needs. “Digitalisation” has become something of an inflationary term in descriptions of spark generators.
An electrically generated spark under an argon atmosphere can be used to excite a large number of elements. Plasma temperatures of over 10,000 K are reached. The resulting spectra are called “spark spectra” and display numerous atomic and ionic lines. Spark excitation can even be used to analyse non-metals like N or O. The alternative arc excitation, which requires several Ampere of current, creates plasmas of lower temperatures and delivers little spectral background and only few ionic lines (“arc spectrum”).The field of spark spectrometry uses the advantages of this method by generating arc-like discharge forms for the detection of several elements.
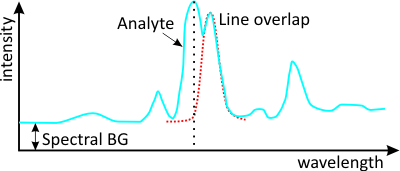 The many advantages of spark spectra come at the expense of several negative boundary conditions that have an effect on the optical layout and the evaluation algorithms. In comparison to low-pressure discharges, spark spectrometers deliver relatively broadened emission lines with a half-width value of about 20 pm. As a result of the optically dense spark plasma, non-excited atoms can absorb light, which leads to a self-absorption effect that increases proportionately with the number atoms of the same element present in the plasma. As a consequence, spark spectrometric calibration functions hardly ever display linear relationships. Furthermore, calibrating spark spectrometers is a complex task due to unavoidable line overlaps and the corrective calculations that are necessary as a result. Hundreds of calibration standards often have to be measured for a single metallic matrix so that optimal calibration functions can be calculated for all element channels.
OBLF GDS III Spark Generator
The electrical energy needed to create the spark in the spark stand is delivered by the so-called spark generator.When generating this excitation energy it is critical to ensure that the power functions provided are extremely reproducible and can be individually modulated to suit the various requirements of the analysis tasks – in the most extreme case for every analytical program and every exposure time. This knowledge having spawned an early wish to use digital technology to contain these problems, it then found fertile ground at OBLF: we already began producing our spark generators exclusively on the basis of semiconductor technology at the beginning of the 1980s – a time when our competitors still had to use an auxiliary sparking distance. As a result of this, our development work to produce a digital spark generator made rapid progress and enabled the successful integration of this technology into OBLF spectrometers at a very early stage of digitalisation. Generators of this kind are called GDS spark generators (Gated Digital Source) and have by now become a firm fixture of the analytical landscape. In fact, they have been state-of-the-art for some years now. From an analytical point of view, these digital spark generators constitute a new dimension because they can deliver the requisite special power function in practically limitless form. As a result, they no longer fit into the usual definition schema with parameters like capacitance, inductance, Ohmic resistance, spark succession frequency or increase of the pre-sparking energy (HEPS). Such parameters are irrelevant when using GDS spark generators because they do not contain any classic discharge circuits that would limit their controllability. Apart from guaranteeing superior flexibility, the digital technology of these spark generators also guarantees extremely reproducible results and naturally renders them maintenance-free.
OBLF GDS Spark Generator – Technical Specifications:
| Discharge characteristics: | digitally definable from medium voltage sparks to arc-type |
| Control variables: | discharge characteristics and duration |
| Current limitation: | short-circuit-proof |
| Technology: | gated current technology |
| Ignition system: | multi-spark |
| Spark succession frequency: | up to 1 kHz |
| Control: | all parameters via optical link |
| Parameter definition: | fully via spectrometer software |
